- Published on
Shallow Myths, Part 1: Shining a Light on Police Obfuscation
- Authors

- Name
- Ctrl-Alt-Defund
- @CtrlAltDefund
At a time when non-violent public safety solutions like Portland Street Response struggle to stay afloat, the Portland Police Bureau (PPB) continues to receive more funding year after year. This increase in funding does not translate to a safer community and police brutality continues to thrive. Using PPB’s own data, obtained through public records, this series of reports examines how PPB ignores issues of brutality and obfuscates harm. Despite claims that additional training lessens violence, we discovered the system enables abuse, time and again.
Click here for our Use of Force Data Analysis
Some Context and a Brief History: PPB Investigated by the Department of Justice
On December 6th, 2023, Portland Police killed Isaac Seavey. The initial police report states police responded to a call about power being stolen from a nearby business. Police officers confronted Seavey and shot him. The police press report stated, “detectives located a handgun near the deceased individual.” The two officers involved were placed on paid administrative leave, as is standard procedure. One of the officers, Justin Clary, has a prior record of police violence.
This incident is far from isolated. A few weeks after Seavey’s death, PPB killed Tyrone Johnson II. Since 2017, 22 people have been killed by the Portland Police Bureau. Wider awareness of police brutality began with the George Floyd protests of 2020, but the Portland Police has a longer history of violence and racial bias. In 2010, PPB murdered Aaron Campbell, a Black community member. Protesters organized, marched, and demanded change. Local leaders like Jo Ann Hardesty and the Albina Ministerial Alliance Coalition for Justice and Police Reform, asked the the US Department Of Justice (DOJ) to investigate PPB’s brutality. After an extensive investigation, the DOJ released their findings, which conclusively stated PPB engages in “a pattern or practice of violating the Constitution or laws of the United States.”
Rather than face deeper scrutiny, PPB and the city entered into a Settlement Agreement with the DOJ. One requirement of the settlement is that an outside group must independently monitor and review the PPB. The Compliance Officer/Community Liaison (COCL) was formed with the responsibility of, “collecting, reviewing, and reporting on data related to the Portland Police Bureau's (PPB) interactions.” COCL reviews PPB's use of force reports (particularly against citizens experiencing mental health crises), accountability processes, and police training. Additionally, COCL gauges PPB’s compliance with the DOJ Settlement and releases quarterly reports. In reviewing the COCL reports, one comment stood out to us from the second quarter report of 2021:
PPB could not comply with Par. 117 which requires PPB to identify problematic use of force trends at the supervisor and team level.
Since then, versions of this same comment remain in COCL’s quarterly report up to the present. Here is this year, 2023:
The goal of capturing outliers in order to ‘address potentially problematic trends in a timely fashion’ is not being accomplished.
COCL’s reports document that in the thirteen years since the DOJ suit began, PPB has failed to resolve its history of violence. The protests that erupted in 2020 and extended into 2022 further revealed PPB’s pattern of violating civil rights of people protesting, brutalizing people, and totally disregarding any attempt to meet the compliance requirements of the the settlement with the DOJ.
Publicly, PPB and their enablers claimed to care about systemic police reform. Portland City Attorney, Robert Taylor, stated to the U.S. Attourney's Office, “City of Portland is committed to public safety reform and the goal of changing its systems and institutions to better serve all members of our community.” Chief Lovell’s annual report for 2020 praised reform and training:
In 2020, the racial justice movement provided opportunities for all communities to re-envision public safety. The Portland Police Bureau was uniquely poised to embrace change, as it has done so for the past nine years under the City’s Settlement Agreement. The Bureau has made substantial reforms to policies and training [emphasis is ours].
We don’t agree with Chief Lovell’s statement. Furthermore, the COCL reports and local DOJ violations prove reform has not been effective. PPB trainings have not reduced deadly use of force incidents inflicted on the citizens of Portland. In 2010 to 2017, there were 29 shootings by PPB with 16 being fatal. From 2017 to present, PPB fired their guns 43 times, 22 fatally. Training cops in a brutal system does nothing to reduce the harm of that system.
In the midst of the 2020 protests, PPB hid the identity of officers. Name badges were removed, helmets simply had digits, and police scanners moved to encrypted channels. Discriminatory cops were not named. Chief Lovell enacted a police policy that delayed publicly identifying officers after shooting a civilian. The reasoning behind this policy was due to a vague threat that was later closed. Discipline records are private, kept from the public entirely. All of this obfuscation only serves to further protect officers who continually engage violence and create increased distrust from the communities they police. Police state they can reform themselves. We hear that a few bad apples can be fixed. After the Rapid Response Team resigned due to one officer facing charges (which were were later dropped), Mayor Wheeler still claimed reform would work. We cannot trust their message.
Portland Police Force Data
It has been over ten years since the DOJ settlement went into effect. Three years ago, the Mayor committed to reforming the police. PPB knelt down in front of protestors in a show of good faith, but within ten minutes, stood up and continued a pattern of violence that ended in 2,378 use of force incidents specific to their protest policing. PPB siloed their protest data from other use of force data and it does not appear in their dashboards or our analysis.
In 2023 alone, PPB documented incidents with one or more uses of force 464 times. If we widen this window to 2017 that is 4,611 uses of force against Portanders. A longer view would be valuable but PPB only provides the data to 2017.
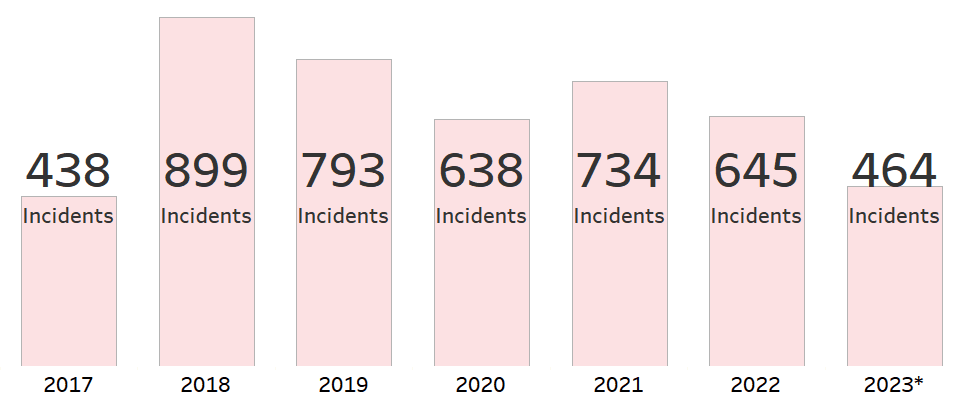
 *2023 data is year to date as of November 17th
Without a robust oversight system, something Mayor Wheeler and council are attempting to scuttle, we are forced to rely on police numbers. Though officers are required to justify a use of force internally, per COCL’s repeated red flags, reports show very little oversight or accountability. The Use of Force Dashboard provided by PPB is updated every 45 days - after incidents are reviewed and filtered using its interpretations. That data includes every use of force from 2017 to present and along a host of critical pieces of info, an identifying number for each officer. Via PPB’s Officer Identification Portal, we asked PPB to provide a name matching the code. Here we name the top users of force per year and identify the very outlier officers COCL has been raising a flag about.
According to the data collected from PPB’s Use Of Force and Officer Identifier form, we created a dashboard visualizing the PPB’s use of force. It is publicly available here.
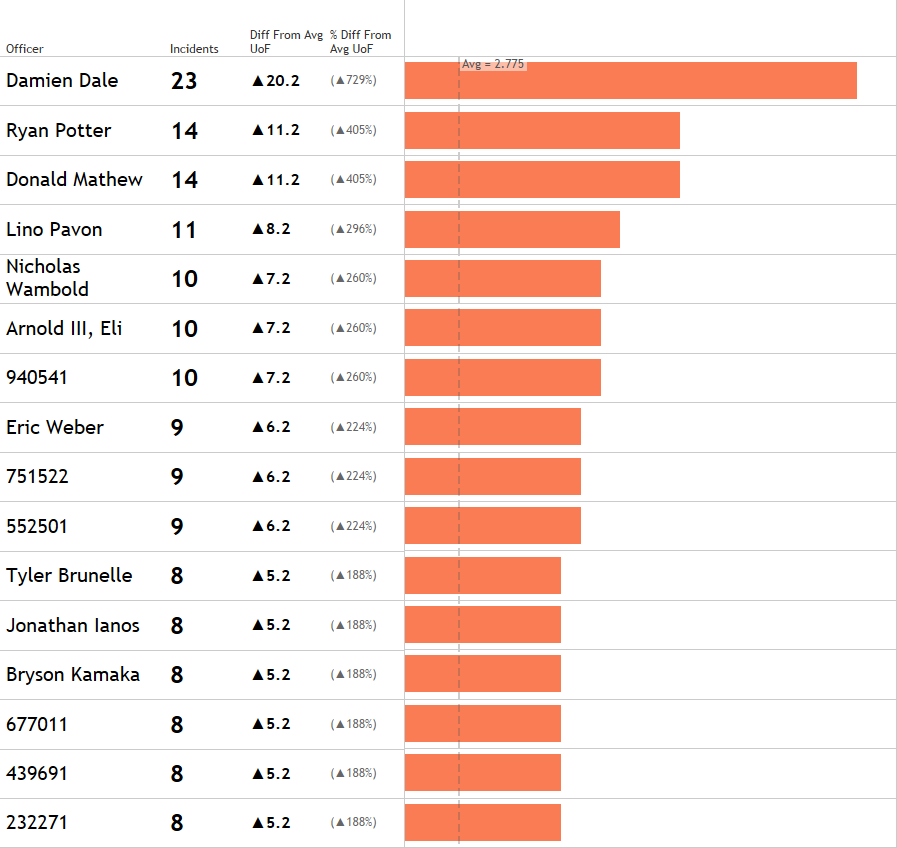
Shown are the top 20 (14 for 2023) officers responsible for force incidents each year, from 2017 to present. COCL called out PPB command for not actioning outliers. Here are those officers. Some have been publicly recognized for attacks while others avoid scrutiny. PPB’s obfuscation works for their protection.
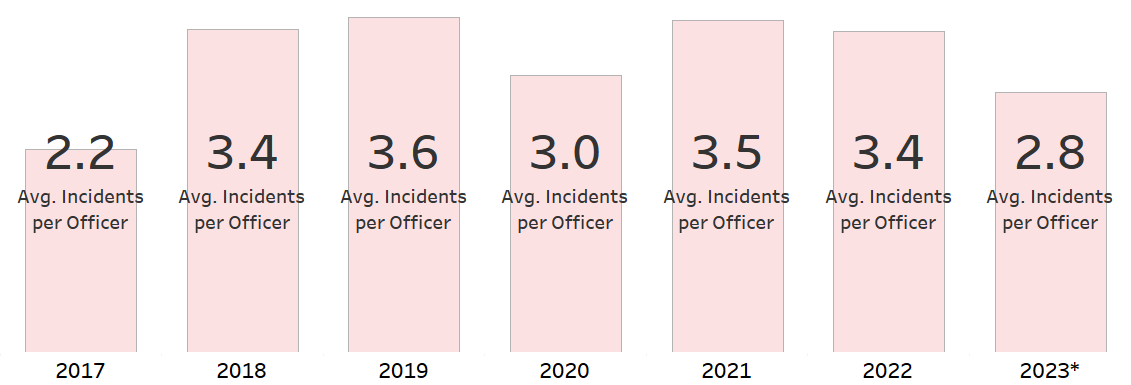
I. Officer Damien Dale used force in 23 incidents through 2023. As police are not usually transparent about names and force it is hard to have a sense of scale and context. To aid in that needed context, we included the average use of force across all officers in the data set per year. The average force incidents per officer for 2023 to date is 2.7. Officer Dale’s rate is 730.32% above the average.
Other Officers who exceeded the average 2.7 incidents for 2023:
It is of note that Dale holds the record for most incidents with force since 2017. However, you won’t find any stories about him this year. The smoke and mirrors continue: cops continue their harm. Command has been documented as viewing police harms as efficacious. The COCL report from Q1 of 2023 reported a conversation with PPB leadership where an unnamed officer was praised for their elevated violence. When asked by a COCL investigator about their rate of force, a commander stated:
[the officer] has a unique ability to locate subjects in stolen cars and felons actively engaged in crime. [Member] utilizes pursuit intervention techniques to mitigate risk to the public, bring resolve and quickly take subjects into custody. [Member’s] proactive work ethic has elevated [their] force ratios compared to [their] peers who are responding to assist officers with calls for service.’ This response essentially boils down to the position that the member’s elevated statistics are not concerning because the member is fighting crime and using force to do so, which justifies their elevated force ratios compared to their peers (COCL Q1 2023).
The police know about brutality and they approve.
II. Examining the outliers for other years, Zach Delong is documented as a top 20 user of force for 2017, 2018, and 2020. In 2018 his violence was at a rate 336.05% above the average. Officer Delong killed a man experiencing houselessness in 2021. He was not reprimanded and a grand jury did not indict him for this use of force incident. The son of Robert Delgado recently filed a federal civil lawsuit, that says in part, Delong “should have recognized he needed to de-escalate the situation because Delgado was in distress.”
We can only speculate but Delong’s reliance on violence was apparent long before he sniped a man from behind a tree. After that death, Delong was promoted to detective in 2021. The systemic obfuscation covers abuse. Delong engaged in violence and leaders allowed it.
III. Ryan Potter’s name appears in the top 20 users of force every year from 2017 to present. He was the top user of force in 2019 after being fourth in 2018 and second in 2017. In 2023, he was second again with 14 use of force incidents. This repeat appearance shows in stark detail PPB’s failure to address the issue, allowing an officer to stay at the top over and over is a systems failure.
Conclusion
“We know that police brutality and the impunity police have enjoyed in so many instances for so long — especially, although not exclusively when it comes to harming and killing Black people — goes back a long time. Police combine their warfare against vulnerable communities with lawfare that covers them when the blue thread, or code of silence, that stitches warfare and lawfare together comes undone.” - Scholar and abolitionist, Ruth Wilson Gilmore.
The long history of policing has held brutality at its core. The recent reports are not a new phenomenon. When citizens demand an end to police brutality, the police system claims it will enact more training and resources to reform current policies and practices. The only solution proposed by the union, the commissioner, and federal government is to ask for more resources in a perpetual cycle. Specific officers are named here but do not let PPB escape by blaming a few bad apples. It is crucial to zoom out and keep in mind the context and history of failures that civil rights groups, activists, and victims of brutality have identified. We focused on COCL reports, and narrowed our analysis to specific officers like Officer Ryan Potter, in the top users of force every year from 2017 to 2023.
In the weeks prior to this report being published, Mayor Wheeler, the PPA, and police, all took steps to water down the demand of the people for police accountability. The teeth were being pulled from recommendations of the Police Accountability Commission who worked hard to build a system of substantive reform. As abolitionists, Ctrl+Alt+Defund are dedicated to a deeper defunding and divestment from policing, but also recognize the harm in Wheeler’s attacks on directional reforms. The police are, after years of failing to police themselves, being asked to again police themselves. Showing these names and data points is not the final goal. "Answers are only as good as the further questions they provoke,” says Ruth Wilson Gilmore. “While for activists, answers are as good as the tactics they make possible." The goals of Ctrl+Alt+Defund and our partners are to ask better questions and spark more tactics for police abolition and harm reduction in Portland. We hope this report and the work that comes from it are not an end, but information that pushes material change and action from our community. These are resources, not closures.
This report was developed by and supported by:
Ctrl+Alt+Defund, Freedom To Thrive, Carceral Tech Resistance Network, and Sisters of the Road.
Appendix
Methodology: How We Obtained Officer Names
PPBs hosts a use of force dashboard, and anyone can download the dataset used to populate. We were able to review every use of force from 2017 to present and the wide range of other info related: the category of force, if the subject was arrested, the day of the week, the force used, the time, demographics of the subject, and most useful for us, and an identifying number for each officer. This data provides an officer ID number but the number is not their badge number, DPSST number, or any previously identified code. Their dashboard states they use a “randomly generated number in order to create calculations (PPB).” However, Rep. Janelle Bynum sponsored and passed some recent state legislation that allowed us to solve another roadblock of police obscuring transparency.
HB 3355 is a little known but powerful source to identify cops. All police in Oregon are required to help identify officers if a community member has at least one of 6 possible pieces of information. Those are: name/partial name of officer, identifying number, full/partial license plate or other identifying number, physical description of the officer, location, date and time at which the officer was present, or a photo of the officer. With any of those, PPB must identify and provide the name of the officer within 14 days. Crucial for us was the “identifying number.” After calculating the top users of force with their randomized number we submitted those codes. 14 days later, we received a list of names. PPB has their portal here and we recommend folks use the tool.
COCL Documentation and Further Quotations
- COCL Report Q2 2021:
- “ issues remain regarding the Force Inspector’s identification of outliers in the force data (p.9)“
- “Additionally, the reviews conducted by the Force Inspector identified PPB members who were outliers with regards to force but for most of these officers, a supervisor review was not documented in EIS (p.9)”
- “Additionally, PPB could not comply with Par. 117 which requires PPB to identify problematic use of force trends at the supervisor and team level. Two issues lead us to find PPB out of compliance with the requirements of Par. 117 (p.10).”
- “ Most members identified by the Force Inspector as being outliers in their use of force did not have any supervisor review documented in the EIS despite the manual alert. This issue also remained in the second quarter of 2021 as we were only able to find one EIS response from supervisors for these manual alerts. For instance, during the quarter, one officer had four arrests, four uses of force, and an average of 3.5 applications per force event. Despite being flagged by the Inspector, there is no corresponding EIS entry by the supervisor indicating a review of the officer. Furthermore, the same exculpatory language from the Force Inspector that we raised in our last report continued during this quarter. For all supervisors flagged, the Inspector stated, “Sergeants do not normally respond to calls for service, so it is not uncommon for them to have high [force rates], as they generally do not use force in their day to day duties.” For other flagged members, the Inspector outright stated, “I do not find anything of concern.” The determination of whether a concern exists should be made at the supervisor level and we maintain our position that the Force Inspector should make sure that the language of the alert does not bias the decision to further review the identified member (p.49)”
- COCL Report Q3 2021:
- “The first reason is that the force data feeding into the EIS algorithm was fundamentally flawed, an issue that remains potential for future events and which we discuss further in Section III of this report. Once PPB conducts a comprehensive review and implements remedial actions, we believe this issue will be resolved and will no longer impact compliance. The second reason was that most members identified by the Force Inspector as being outliers in their use of force did not have any supervisor review documented in the EIS despite the manual alert. This continued to remain in the third quarter of 2021. There continued to be a lack of information about what happened to these officers after the notification as the RU Manager responses did not contain any information about possible interventions that were implemented as a result of manual alerts. For instance, one officer had eleven FDCRs in the second quarter13 while having 35 arrests, resulting in a force-to-arrest ratio of 31.4%. Additionally, the PPB’s quarterly force summary report indicates a total of 475 uses of force Bureau-wide for the second quarter, meaning one officer was responsible for 2.3% of the entire Bureau’s uses of force for the quarter. Despite this, the Force Inspector appeared to dismiss the risk, stating, “I have examined [Officer’s] force numbers going back to Q2 2020 and have found nothing to indicate this is a trend and I do not have concerns regarding [their] use of force at this time…This type of exculpatory language continues to be an issue and negates the very purpose of an EIS system. An officer who does not appear to have a history of high force rates but is suddenly responsible for 2.3% of the entire Bureau’s use of force is exactly the type of situation that warrants closer review to determine if personal or work stressors are leading to potentially problematic behavior. However, the reviewing RU Manager was informed by the Force Inspector that there is no need for concern and the RU Manager did not address the issue in the response back to the Force Inspector (indicating no action was taken with the officer).(p.48)”
- “ Presently, the PPB uses a single item threshold model based on the requirements of the Settlement Agreement. However, such models come with limitations that PPB will need to consider when evaluating whether the current system is capable of effectively identifying at-risk personnel. For example, depending on patrol areas and shift times, some officers are likely to have more arrests and, as a result, more use of force events. This can cause the EIS to create false positive alerts (i.e., identifying officers who will not actually go on to have an adverse event). When the EIS has a high rate of false positives, it has the potential to undermine the system and challenge the legitimacy of the process (p.47)”
- COCL Report Q4 2021:
- “...in the fourth quarter the Force Inspector did not proactively identify any “at-risk employees, supervisors [or] teams”, instead forwarding the results document to the RU Manager for their review. As a result, there was a lack of documentation as to the decisionmaking process for outliers since no officers, units, or groups received an EIS entry as a result of the Inspector’s analysis”
- “As a result, there was a lack of documentation as to the decisionmaking process for outliers since no officers, units, or groups received an EIS entry as a result of the Inspector’s analysis.”
- COCL Report Q1 2022:
- “Instead of proactively identifying “at-risk employees, supervisors [or] teams” the Force Inspector forwarded force application reports to RU Managers for review. Consequently, there was a lack of documentation of the decisionmaking process in EIS. The PPB informed the COCL that changes were made to this process during the second quarter of 2022 to achieve Substantial Compliance and we will report on these changes in our next report (p.8).
- “We also maintain our position from prior reports that PPB should seek to ensure that the EIS is “more effectively identify[ing] at-risk employees, supervisors and teams to address potentially problematic trends in a timely fashion” (Par. 116). Initial discussion regarding an EIS evaluation occurred in the first quarter, but no significant progress was made. The COCL has previously provided the PPB and the DOJ with a draft methodology and data analysis plan and are awaiting further discussion with PPB. We will continue to provide updates of this process in our future reports (p.8).”
- “In addition to these reviews, we maintain concern with the process by which the Force Inspector identifies “at-risk employees, supervisors, [or] teams.” Specifically, the Force Inspector continues to send only the Force Application spreadsheet to RU Managers rather than proactively identifying “at-risk employees, supervisors [or] teams” for additional discussion. As a result, there continues to be a lack of documentation as to the decision-making process for outliers since we received no evidence that any officers, units, or groups were further reviewed based on the Inspector’s analysis. While the PPB informs us this process changed in the second quarter, it remained deficient for the first quarter (p.127).”
- COCL Report Q2 2022:
- “As with prior quarters, we also continue to have concerns on how the term “de-escalation" is used by PPB members. For instance, in the case described above, the use of spike strips and the tactical positioning of a patrol car to box in the subject were considered de-escalation tactics, despite the fact that the officer stated the reason for the actions were to prevent the subject’s escape. As such, we reiterate our position that PPB should reassess the ways in which officers have been using the term “de-escalation” and take corrective action as needed. Should we continue to see the term loosely used repeatedly, re-training throughout the entire organization may become a necessary component of ongoing compliance (page 34)
- “The COCL’s concern about the PPB reporting force statistics but not discussing the overall statistical trends. Certainly, a single quarter of data does not indicate a trend and we do not intend to imply that PPB should provide single-quarter commentary. However, as these are public facing documents, PPB should provide more robust discussion about changes over time even if the changes are due to seasonality, changes in the number of arrests, or there is no readily available explanation (page 47).”
- “conducting statistical analyses on force trends means little when it is done simply as a matter of routine and specific actions are not taken as a result. The analyses done by the Force Inspector and force analysts offer substantial opportunity for the PPB to reduce use of force by addressing emerging trends. However, we have not seen sufficient action from the PPB when the data indicate potential areas of improvement (page 47).”
- “Additionally, the quarterly comparative analysis prepared by the Inspector provides an immensely important and detailed comparison of several organizational levels, including by officer, assignment, unit, RU Manager, and days off. This document allows RU Managers to see which of their officers are using force at comparatively higher rates. In previous reports, the COCL has raised concern over the process by which the Force Inspector identifies “at-risk employees, supervisors, [or] teams.” These concerns have not been alleviated and we will need to schedule a meeting in the coming months to resolve this issue given the impact on these paragraphs as well as with Pars. 116-117 (see our assessment of those paragraphs for a more fulsome explanation of the concerns) (page 47).”
- In previous reports, we have raised concern over the process by which the Force Inspector identifies “at-risk employees, supervisors, [or] teams.” Previously, the Force Inspector sent only the Force Application spreadsheet to RU Managers rather than proactively identifying “at-risk employees, supervisors [or] teams” for additional discussion. As a result, there was a lack of documentation as to the decision-making process for outliers since we received no evidence that any officers, units, or groups were further reviewed based on the Inspector’s analysis. For the second quarter of 2022, the Force Inspector did not rectify this issue by identifying specific 143 COCL Quarterly Report: Quarter 2 Updates & Analysis, April 1, 2022 to June 30, 2022 officers and, although the Force Inspector did request additional feedback information from RU Managers, it was extremely minimal and isn’t responsive to our broader concerns. For instance, the Force Inspector provided the Force Applications Spreadsheet and instructed the RU Manager that for all members being two or more standard deviations above the mean, the RU Manager should “document discussions with the members deemed to require intervention in their EIS/PDT, and list the remaining members in the precinct alert with the reasons they do not require additional intervention.” For two precincts, the RU Manager did not provide an individualized response and the one RU Manager who did only did so upon prompting and only listed the names saying “I do not have any concerns with the deviations.” Overall, there appears to be a misunderstanding of what the spreadsheet is designed to accomplish. This is most apparent from one RU Manager whose response stated, “Nearly all the officers that were highlighted for using Cat 4 levels of force and nearly all work in the Downtown core or the force was from a significant event.” However, “working in the Downtown core” is irrelevant since the officers are being compared to their peers in similar assignments. They are not being compared to officers assigned to other areas and therefore should not be summarily dismissed in this way. Furthermore, the current approach does not rely on the expertise of the Force Inspector to focus on those who might truly be problematic. For instance, in East Precinct, the RU Manager indicated reviewing 72 members, though many of these are likely not an issue and are only highlighted due to low relative arrests or some other explanatory factor. Therefore, it is not surprising that the RU Manager would give a blanket statement that there were no concerns as it is unreasonable that they would provide the in-depth review that should be expected with each of the 72 individuals. We maintain our position that it is the responsibility of the Force Inspector to review the spreadsheet, filter out those who, based on the benchmark data, would not be a cause for concern and only forward on those members who would be. This was PPB’s practice in the past and they will need to return to this practice to return to Substantial Compliance. Finally, we maintain our position from prior reports that the PPB should seek to ensure that the EIS is “more effectively identify[ing] at-risk employees, supervisors and teams to address potentially problematic trends in a timely fashion” (Par. 116). The COCL provided the PPB and the DOJ with a draft methodology and data analysis plan during the second quarter of 2022. Discussions regarding the analysis plan were held during the third quarter and we will provide updates as this process progresses in our future reports (142-143).”
- COCL Report Q3 2022:
- “PPB agrees to enhance its EIS to more effectively identify at-risk employees, supervisors and teams to address potentially problematic trends in a timely fashion (p.130).”
- “However, we continue to find that the way PPB and the Force Inspector identifies “at-risk employees, supervisors, [or] teams” is undervalued and underutilized. PPB possesses a Force Applications Spreadsheet which lists each officer in PPB, grouping them by Precinct and Shift, and conducting a comparative analysis of their overall use of force (in raw numbers), each type of force used, and standardized statistics comparing FDCRs and applications to the number of calls for service, reports written, and arrests. This spreadsheet provides an opportunity for the Force Inspector to take a narrowed focus on specific members for whom force statistics are elevated and have an in-depth conversation with their supervisors to identify solutions to reducing their overall uses of force. For instance, in reviewing the Q3 Force Applications spreadsheet, one officer had the following statistics compared to other officers within the same Precinct and Shift:
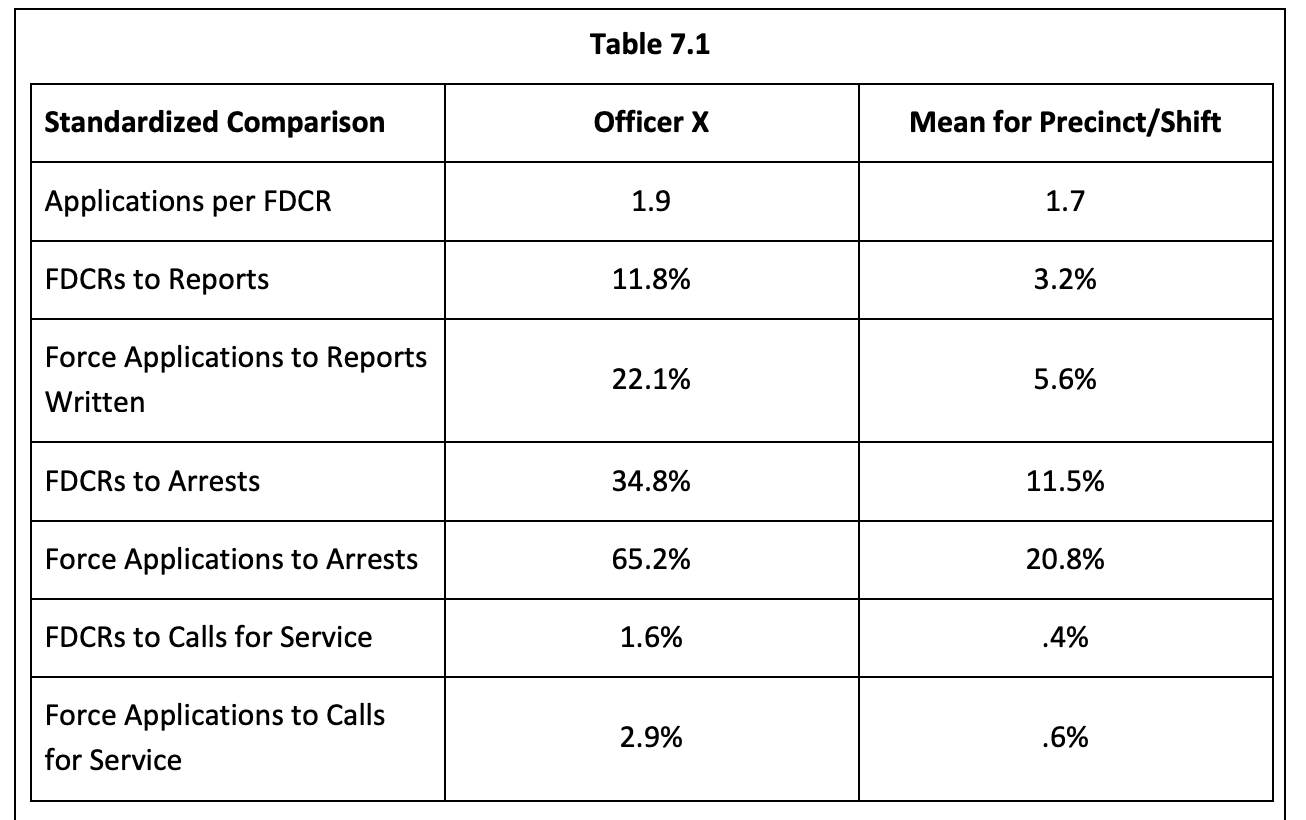
- “For many of these statistics, the officer was 3-4 times higher than the average of all other officers. For instance, the mean for the Precinct/Shift in FDCRs (i.e., use of force events) to calls for service was .4%, meaning that, on average, officers in that Precinct/Shift had a force event once every 250 calls for service during the third quarter. For this specific officer, they had a force event once every 62.5 calls for service during the third quarter. Other officers follow similar trends. For instance, the spreadsheet for 2021 Q4 to 2022 Q3 spreadsheet (a one-year comparison) identified one officer with a .9% FDCR to calls for service average whereas their Precinct/Shift had a .2% average. This officer had 18 FDCRs though other similarly-situated officers (i.e., officers in the same Precinct/Shift with similar numbers of calls for service, reports written, and arrests) had 7 or fewer FDCRs in the one-year period. Similarly, using the one-year comparison spreadsheet, one officer had comparatively few calls for service – out of the 46 officers listed on the spreadsheet for the Precinct/Shift, the officer ranked 5th from the bottom with respect to calls for service with 675 calls for service (the average for the Precinct/Shift for the year was 1,391.7). However, the officer had 5 FDCRs whereas the entire Shift/Precinct had an average of 3.28 FDCRs for the year. Therefore, despite being 52% below the average in calls for service, the officer was 52% above the average in use of force events for the year (p.132)”
- “As noted in prior reports, we do not believe these types of comparisons are being thoroughly discussed nor do we believe that sufficient force mitigation efforts are being taken as a result of the peer-comparison. During the fourth quarter (though focusing on third-quarter data), we observed two meetings between the Force Inspector and Precinct Commanders. Although we found that they did discuss some particular officers that had higher rates of force, the higher rates were dismissed for reasons that did not fully explain the disparity. For instance, in discussing one officer, we heard that the higher rates of force were due to the officer being part of a partner car and therefore often acting as cover. However, this does not explain the fact that other officers are also working partner cars and still have relatively lower rates of force. Furthermore, as discussed below, PPB possesses intervention options that would address these causes (e.g., temporary re-assignment) and therefore the officer’s assignment should not be the sole justification for dismissing the higher force rates. Furthermore, in reviewing the Q3 responses from Precinct Commanders and Captains based on the Q2 spreadsheet, we noted one stated that they further reviewed nine specific officers. This is wholly in line with what we would expect for this process. However, the review consisted of reviewing the specific force events, finding them in-policy and consistent with training. This is what the AAR process is for and this does not explain why, compared to their similarly-situated peers, these officers still exhibited higher rates of force. The peer-comparison EIS process that PPB uses has the potential to better manage force throughout the Bureau. However, we do not currently believe PPB is currently using EIS to its full potential and interventions based on the peer-comparison approach are rare. In order to best utilize the system, as well as to return PPB to substantial compliance with this paragraph, we provide the following technical assistance (p.133).”
- “Each quarter, the Force Inspector generates the Force Applications Spreadsheet for both the specific quarter as well as for a one-year retrospective. Where a sufficient number of events exist (i.e., calls for service, arrests, or reports written), the Force Inspector should identify members who have engaged in significantly higher rates of force compared to other, comparable, officers. While we recognize that this requires some subjectivity, we recommend the Force Inspector use the above officer descriptions as examples of individuals who may be considered potentially problematic. We further acknowledge that, by the sheer nature of statistics, there will always be an officer who used the “most force” in a given period. However, the officers in our examples were not simply at the end of the bell-curve; they represented outlying cases that exceeded 3 (and at times 4 or more) standard deviations above the mean. As it is the Force Inspector’s role to manage force within the Bureau (see Par. 35), it is their responsibility to identify these outliers who represent the largest cause for concern. During this quarter, the inspector failed to do so (133-134)”
- “EIS is designed to capture outliers when comparing officers to their peers. We identify outliers to address problematic trends with constructive interventions. We seek to prevent poor outcomes – to the community and to officers – before they occur, and prevent career-ending behavior”
- “at present, the system is not being used this way and appears to be distrusted and viewed as punitive by PPB members, potentially rendering it ineffective (though further analysis is necessary to determine whether the system is truly ineffective)(p.135).”
- COCL Report Q4 2022:
- “In reviewing commanders’ written responses for the individuals discussed during the meeting, we continue to see language which does not address the underlying concerns (i.e., that these individuals represent a statistical anomaly) but rather focuses on the specific uses of force. For instance, one officer had 8 FDCRs in 2022 Q3 (meetings which occur in Q4 use Q3 data to drive the discussion). In discussing this officer, the commander commented that they were “a highly active officer in a busy district [that] had 13 of 15 uses of force20 that were cat 4, no concerns.” This ignores the fact that all other officers with similar measures of being “highly active” (including one officer who had nearly double the number of calls for service and 3x the number of arrests) had three or fewer uses of force during the quarter. Another commander stated that the underlying force events for a different officer “were reviewed and found to be in policy without concern.” This again ignores the fact that EIS is non-disciplinary and therefore whether or not the force was within policy should not be the evaluative focus – the focus instead should be on why the member is a statistical outlier and seek to determine if intervention, coaching, additional training, or other types of assistance "in a timely fashion” is necessary. We continue to point the PPB to their own training (p.130)”
- COCL Report Q1 2023:
- “, we continue to find that the status of these members as statistical outliers is secondary to justifying the behavior. For instance, in one response, the commander states that the member “has a unique ability to locate subjects in stolen cars and felons actively engaged in crime. [Member] utilizes pursuit intervention techniques to mitigate risk to the public, bring resolve and quickly take subjects into custody. [Member’s] proactive work ethic has elevated [their] force ratios compared to [their] peers who are responding to assist officers with calls for service.” This response essentially boils down to the position that the member’s elevated statistics are not concerning because the member is fighting crime and using force to do so, which justifies their elevated force ratios compared to their peers. However, this ignores the fact that statistical ratios already control for the fact that some officers will be more active than others (p.130).
- “we continue to find that the goal of capturing outliers in order to “address potentially problematic trends in a timely fashion” is not being accomplished (p.130).”
- COCL Report Q2 2023:
- “Using the last four quarters of PPB use of force data (2022 Q3 through 2023 Q2), we compared PPB officers on the number of force events over that one-year timeframe. We then conducted descriptive analysis to identify outliers in the data (e.g., officers who were 2+ standard deviations above the mean compared with other officers). From the data, we identified 18 officers who were 2+ standard deviations above the means and for each of these officers, we requested the following information from the PPB: - The total number of EIS alerts the officer received for any alert category - The total number of EIS alerts related to use of force - The total number of EIS alerts related to force that were forwarded for supervisory review - The total number of EIS alerts related to force that led to any type of intervention - The total number of EIS alerts related to force in which the intervention was something other than Coaching Conducted - The outcome associated with each EIS alert (p84)”